
In today’s data-driven world, businesses don’t struggle with finding numbers—they struggle with finding clarity. Key Performance Indicators (KPIs) provide that clarity. A well-chosen KPI translates strategy into measurable signals that help teams focus, improve, and decide. Whether you lead a startup or manage a global brand, KPIs ensure your day-to-day execution aligns with long-term outcomes.
What Is a KPI?
A Key Performance Indicator (KPI) is a quantifiable metric that signals progress against a specific goal. It’s not “just a number”—it’s a decision-enabling measurement tied to strategy.
Examples:
- If your goal is to grow subscription revenue by 25% this year, your KPI could be Monthly Recurring Revenue (MRR) and Net Revenue Retention (NRR).
- If your goal is operational excellence in manufacturing, a KPI could be Overall Equipment Effectiveness (OEE) and First Pass Yield.
- If your hotel wants higher profitability, KPIs could include Occupancy Rate, Average Daily Rate (ADR), and Revenue per Available Room (RevPAR).
KPI vs. Metric:
All KPIs are metrics, but not all metrics are KPIs. A KPI is a priority signal—it directly informs strategic decisions. A metric can be useful context, but if it doesn’t influence decisions or outcomes, it isn’t “key.”
Why Use KPIs? (The Strategic Bridge)
KPIs serve as a bridge between strategy and execution. They help you convert aspirations (e.g., “be customer-first”) into specific measures (e.g., Customer Satisfaction Score (CSAT), Net Promoter Score (NPS)) that drive actions at the front line.
Core reasons to use KPIs:
- Measure Progress: Track how you’re performing against targets and course-correct quickly.
- Align Teams: Create shared understanding of what “success” looks like.
- Expose Gaps: Identify bottlenecks and root causes (e.g., high churn may signal poor onboarding).
- Drive Accountability: Make performance visible and actionable, ensuring ownership across teams.
Benefits of KPIs: Actionable Insights & Decision Support
KPIs are most useful when they are actionable: they point to clear next steps. The best KPIs are paired with thresholds and targets so that when a number moves, everyone knows what to do.
1) Actionable Insights
- Trigger conditions: “If Churn > 5%, escalate customer success interventions.”
- Playbooks: “If OEE < 80%, check planned downtime, quality issues, and changeover efficiency.”
- Ownership: Tie each KPI to a specific team or role.
2) Decision Support
KPIs turn data into decision signals:
- Portfolio decisions: “Increase paid acquisition only if CAC < LTV × target ratio.”
- Operational decisions: “If Wait Time exceeds 15 minutes, reallocate staff.”
- Product decisions: “If Feature Adoption < 30% in 60 days, revisit onboarding.”
3) Transparency & Focus
Dashboards with clear KPIs create a shared language. They simplify complex systems into a handful of meaningful indicators, reducing noise and enabling cross-functional alignment.
4) Strategic Fit
Great KPIs ladder up to your strategy:
- Growth strategy → Revenue, NRR, Market Share.
- Efficiency strategy → Unit Cost, Cycle Time, OEE.
- Customer-centric strategy → CSAT, NPS, First Contact Resolution.
KPI Design Checklist (SMART + Context)
Use this checklist when defining KPIs:
- Specific: Linked to a clearly defined goal (e.g., “Reduce onboarding time to 7 days”).
- Measurable: Quantified, with a clear calculation formula.
- Achievable: Realistic, based on historical baselines and capacity.
- Relevant: Directly influences strategic outcomes.
- Time-bound: Reported on a cadence (daily, weekly, monthly).
Plus:
- Owner: Who ensures actions are taken?
- Target & Thresholds: What’s good/bad/critical? (e.g., Churn < 4% = green; 4–5% = yellow; >5% = red)
- Data Quality: Is the source stable, timely, and trustworthy?
- Leading vs Lagging: Balance early warning signals (leading) with outcome measures (lagging).
Examples of KPIs Across Industries
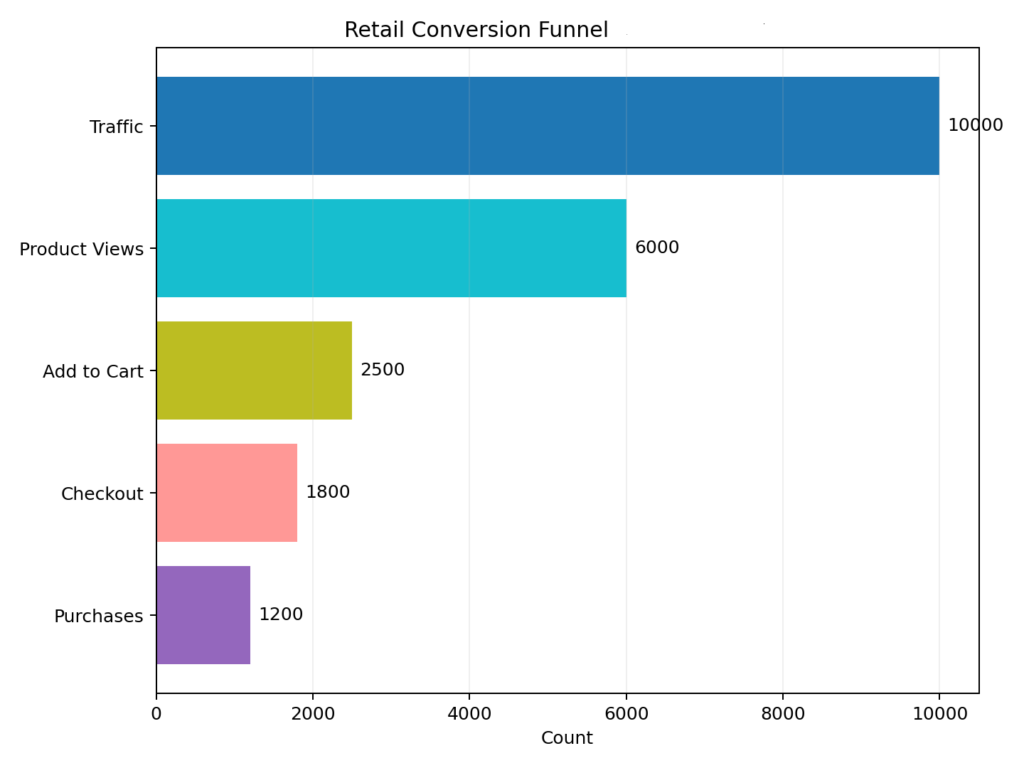
Retail
- Conversion Rate: Measures the percentage of visitors who complete a purchase. A low rate may indicate issues with product pages or checkout flow.
- Average Order Value (AOV): Revenue ÷ Orders. Higher AOV often signals successful upselling or bundling strategies.
- Inventory Turnover: COGS ÷ Average Inventory. Indicates how efficiently stock is sold and replenished. Low turnover may mean overstocking or weak demand.
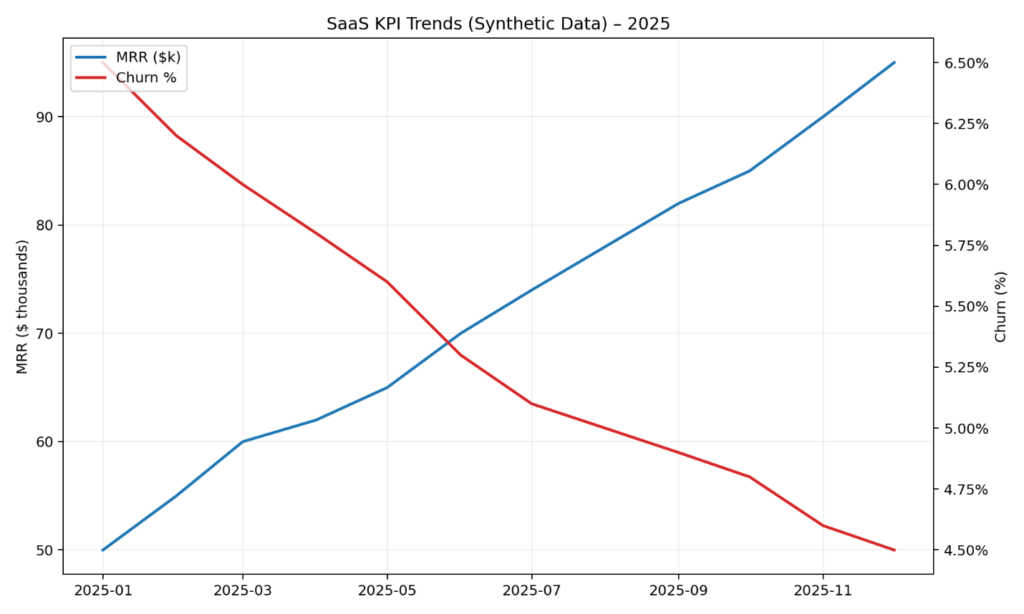
SaaS
- Monthly Recurring Revenue (MRR): Core growth metric for subscription businesses. Track trends to forecast revenue and cash flow.
- Customer Churn Rate: Lost customers ÷ total customers. High churn signals onboarding or product fit issues.
- Net Revenue Retention (NRR): Accounts for expansions, contractions, and churn. NRR > 100% means existing customers are growing in value.
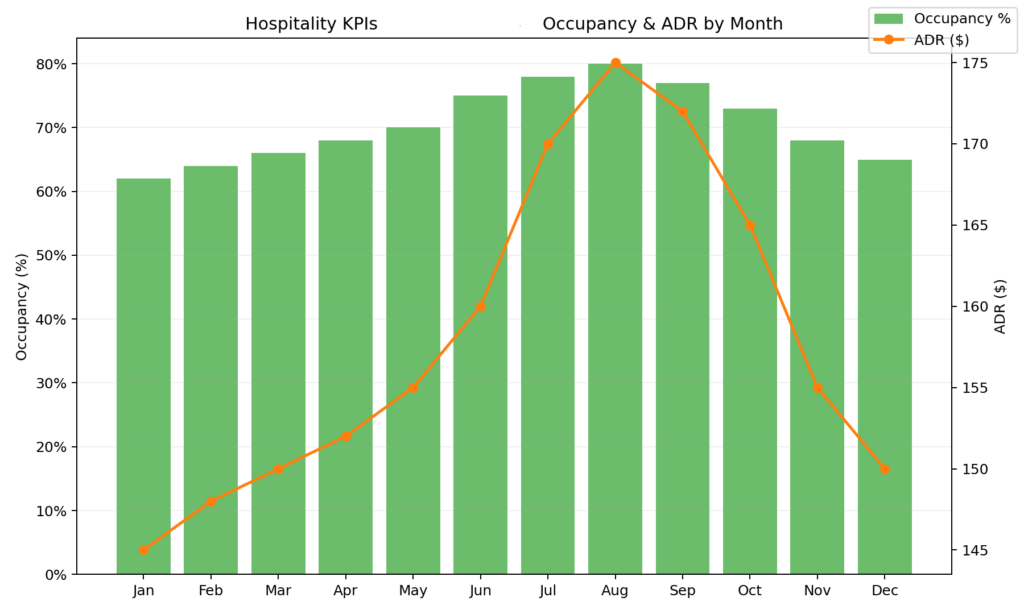
Hospitality
- Occupancy Rate: Rooms sold ÷ rooms available. Indicates demand and capacity utilization.
- Average Daily Rate (ADR): Room revenue ÷ rooms sold. Reflects pricing power and market positioning.
- RevPAR: ADR × Occupancy. A key profitability metric combining rate and volume.
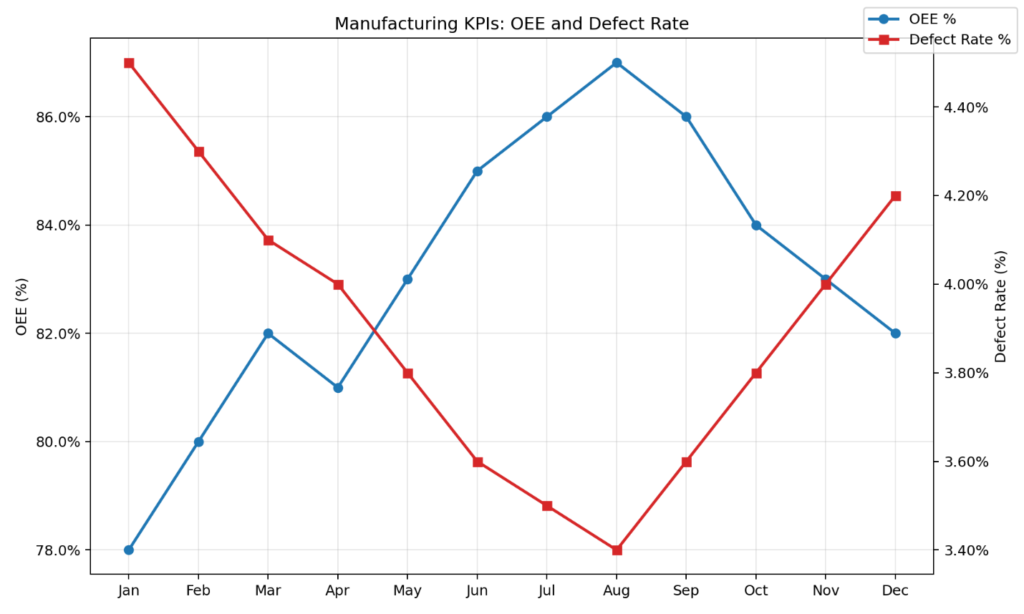
Manufacturing
- Overall Equipment Effectiveness (OEE): Availability × Performance × Quality.
- First Pass Yield (FPY): Good units ÷ Total units on first try.
- Defect Rate: Defects ÷ Total units.
- Cycle Time & Lead Time: Time to complete a process or deliver an order.
- Schedule Adherence: Actual production vs planned.
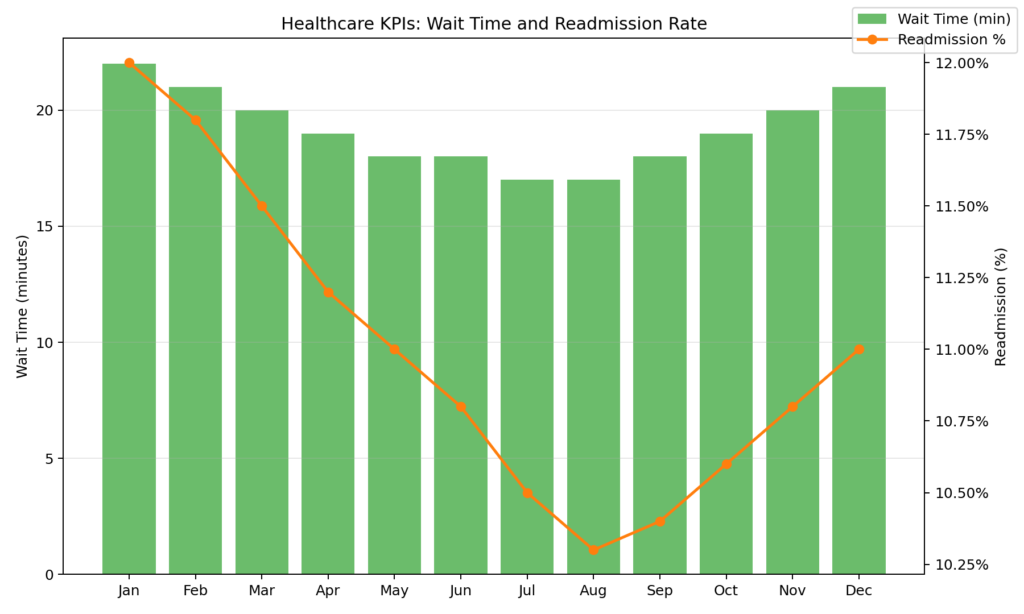
Healthcare
- Patient Wait Time: Impacts satisfaction and throughput.
- Readmission Rate: Indicates care quality and discharge planning effectiveness.
- Treatment Success Rate: Measures clinical outcomes.
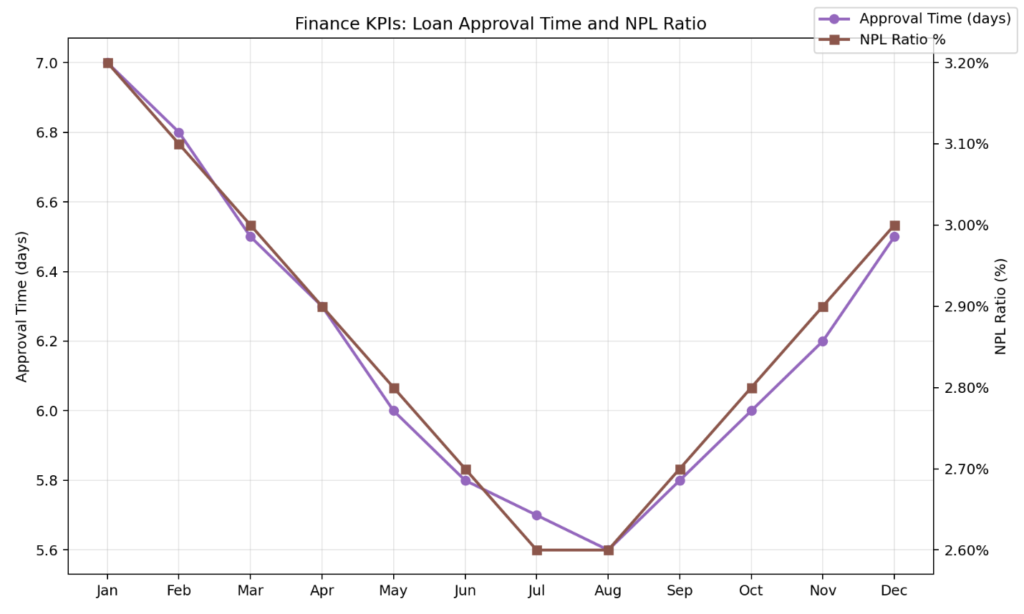
Finance
- Loan Approval Turnaround: Speed of processing impacts customer experience.
- NPL Ratio: Non-performing loans ÷ total loans. High ratios signal credit risk.
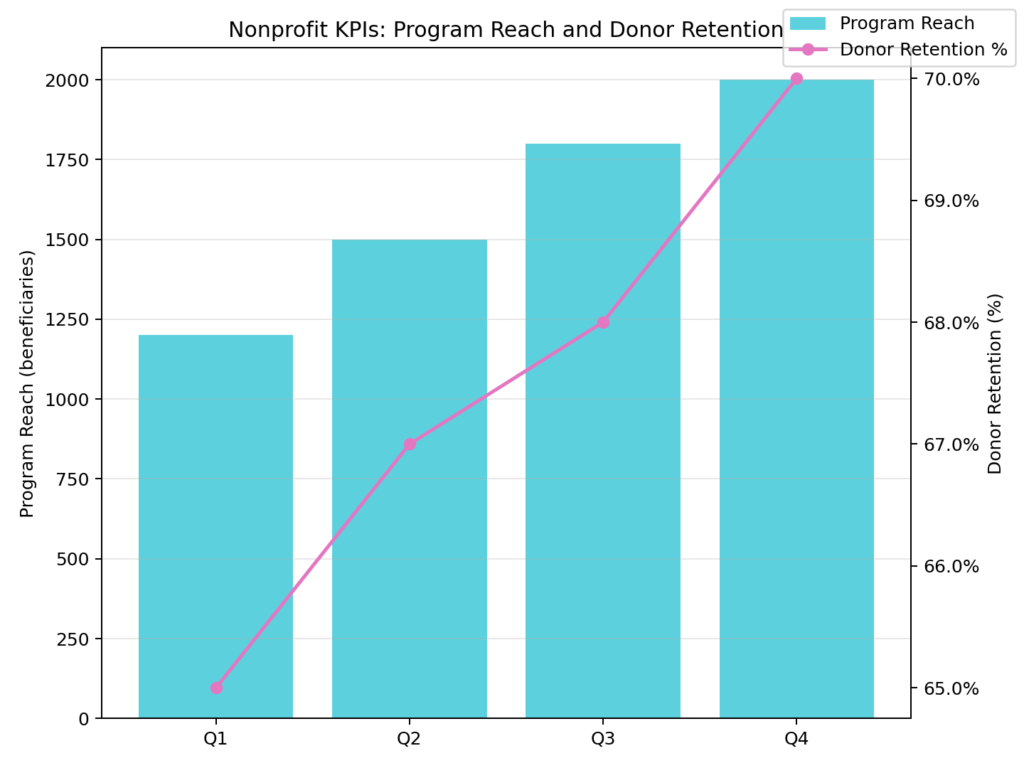
Nonprofits
- Program Reach: Beneficiaries served. Indicates mission impact.
- Donor Retention Rate: % of donors who give again. Critical for sustainability.
How to Choose the Right KPIs (Step-by-Step)
Start with Strategy
Write down your top 3–5 strategic goals (e.g., “Grow profitable revenue,” “Delight customers,” “Scale efficiently”).
Map Drivers & Outcomes
For each goal, list leading indicators (drivers you can influence) and lagging indicators (outcomes you deliver).
- Example (SaaS Growth): Leading—Activation Rate, Trial-to-Paid Conversion. Lagging—MRR, NRR.
Define KPI Formulas & Targets
Be explicit about calculations (e.g., “Churn = customers lost ÷ customers at start of month”) and set targets informed by baselines.
Assign Ownership & Cadence
Who reviews the KPI? How often? What actions are triggered?
Instrument & Automate
Ensure data is sourced and refreshed automatically (CRM, ERP, analytics tools) with clear data lineage.
Review & Evolve
KPIs aren’t permanent. Retire vanity metrics, refine formulas, and add new KPIs as your strategy matures.
Common Pitfalls (and How to Avoid Them)
- Too many KPIs: Focus on a handful (3–7 per team) that truly drive outcomes.
- Vanity metrics: Page views without conversion context won’t drive decisions.
- No thresholds or playbooks: A KPI without a response plan isn’t actionable.
- Misaligned incentives: Ensure KPIs don’t incentivize behaviors that hurt long-term goals (e.g., discounting that harms margins).
- Poor data quality: Garbage in, garbage out—invest in reliable sources and governance
Turning KPIs into Decisions: A Simple Operating Rhythm
- Weekly huddles: Review leading indicators and operational KPIs. Identify 1–2 actions per KPI.
- Monthly reviews: Assess lagging indicators (e.g., MRR, RevPAR, margin). Make resource allocation decisions.
- Quarterly strategy checks: Validate KPI set against changing market conditions and goals.
Pro tip: Pair each KPI with a context chart (trend over time) and a target band (green/yellow/red). This transforms static numbers into decision-ready insights.
Conclusion
KPIs aren’t about reporting—they’re about action. The right KPIs sharpen focus, simplify decisions, and accelerate outcomes. Start with strategy, define clear formulas, and pair each KPI with a response plan.